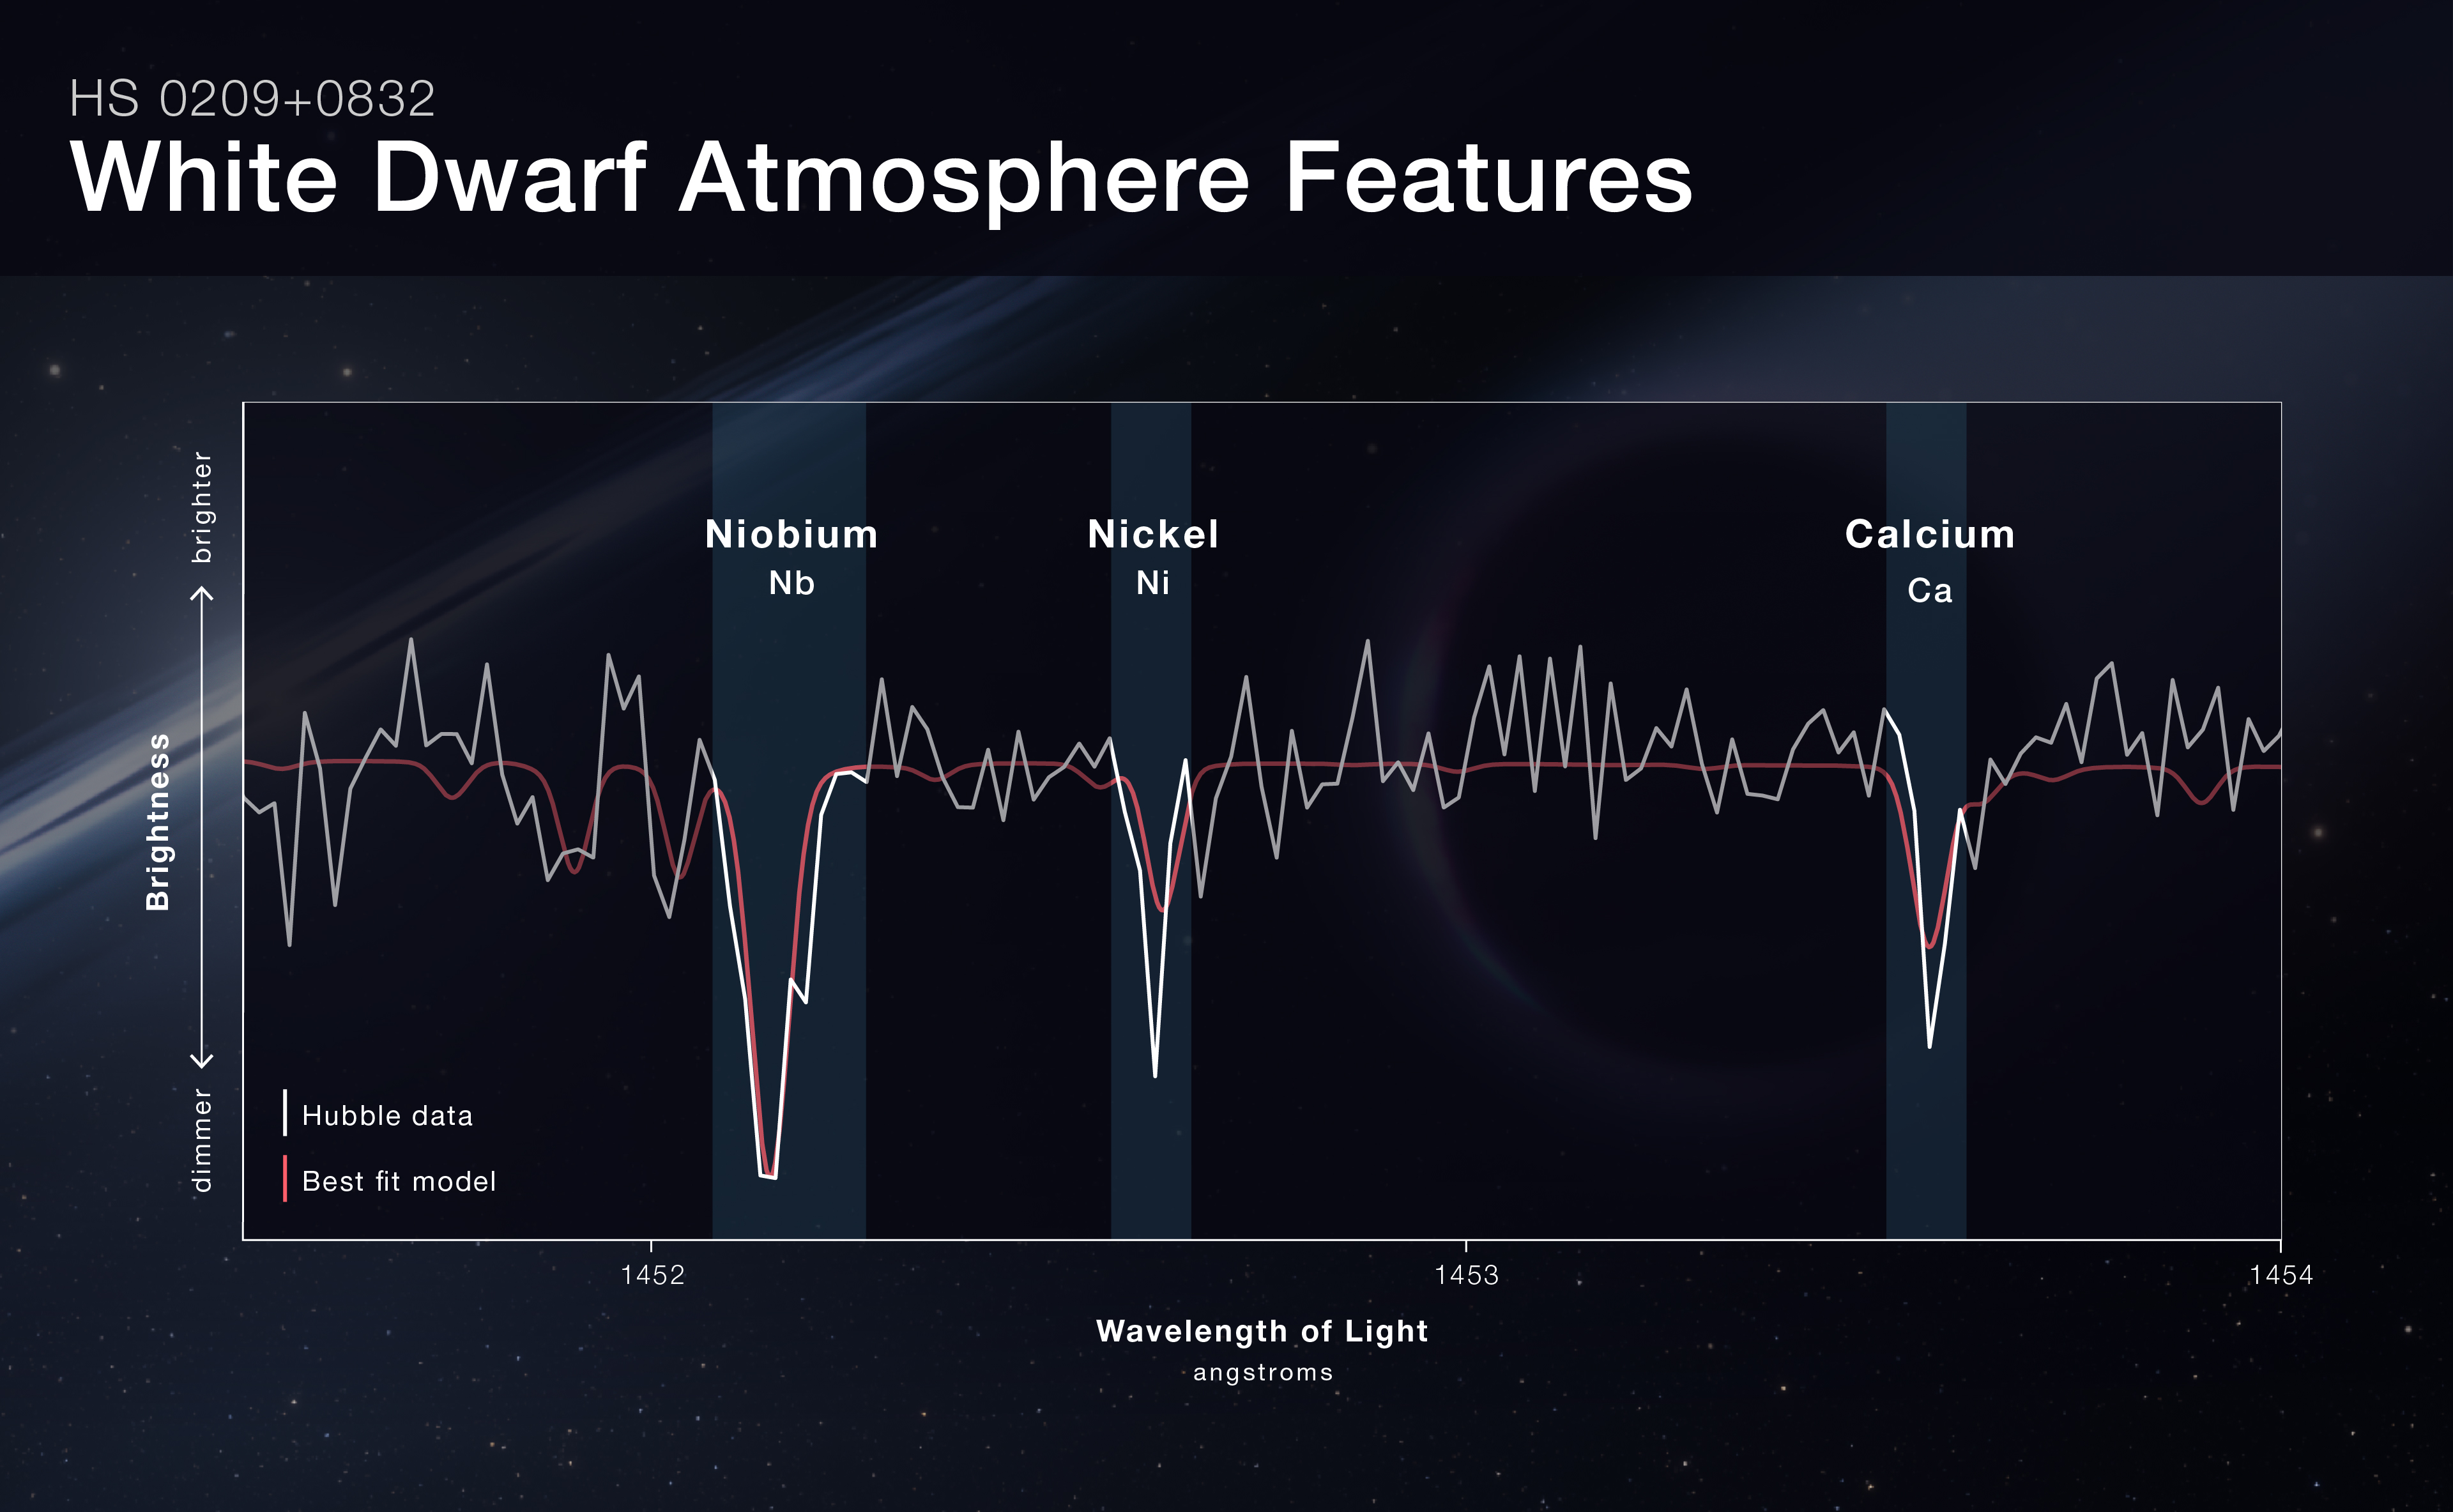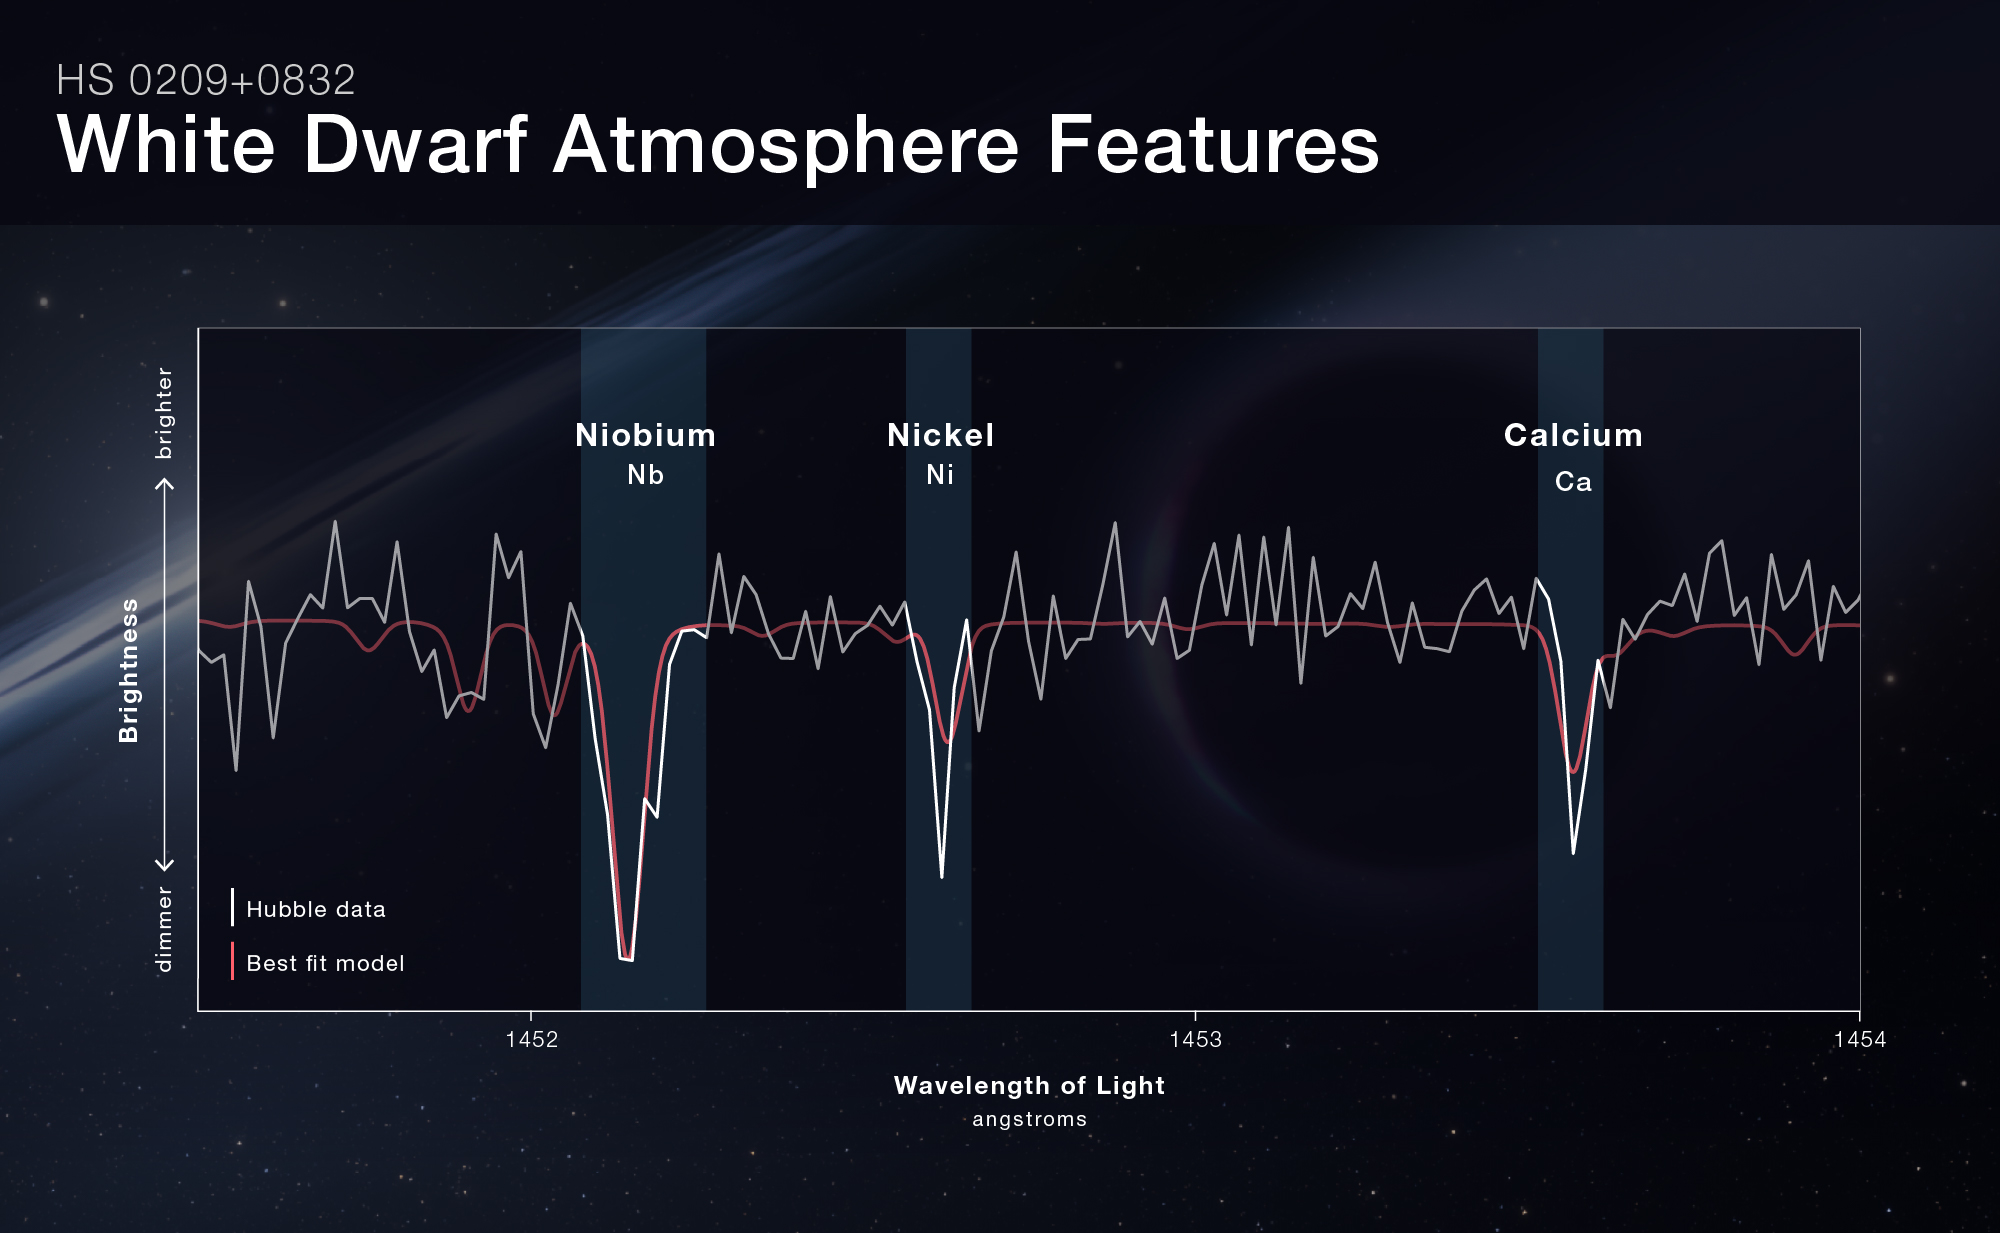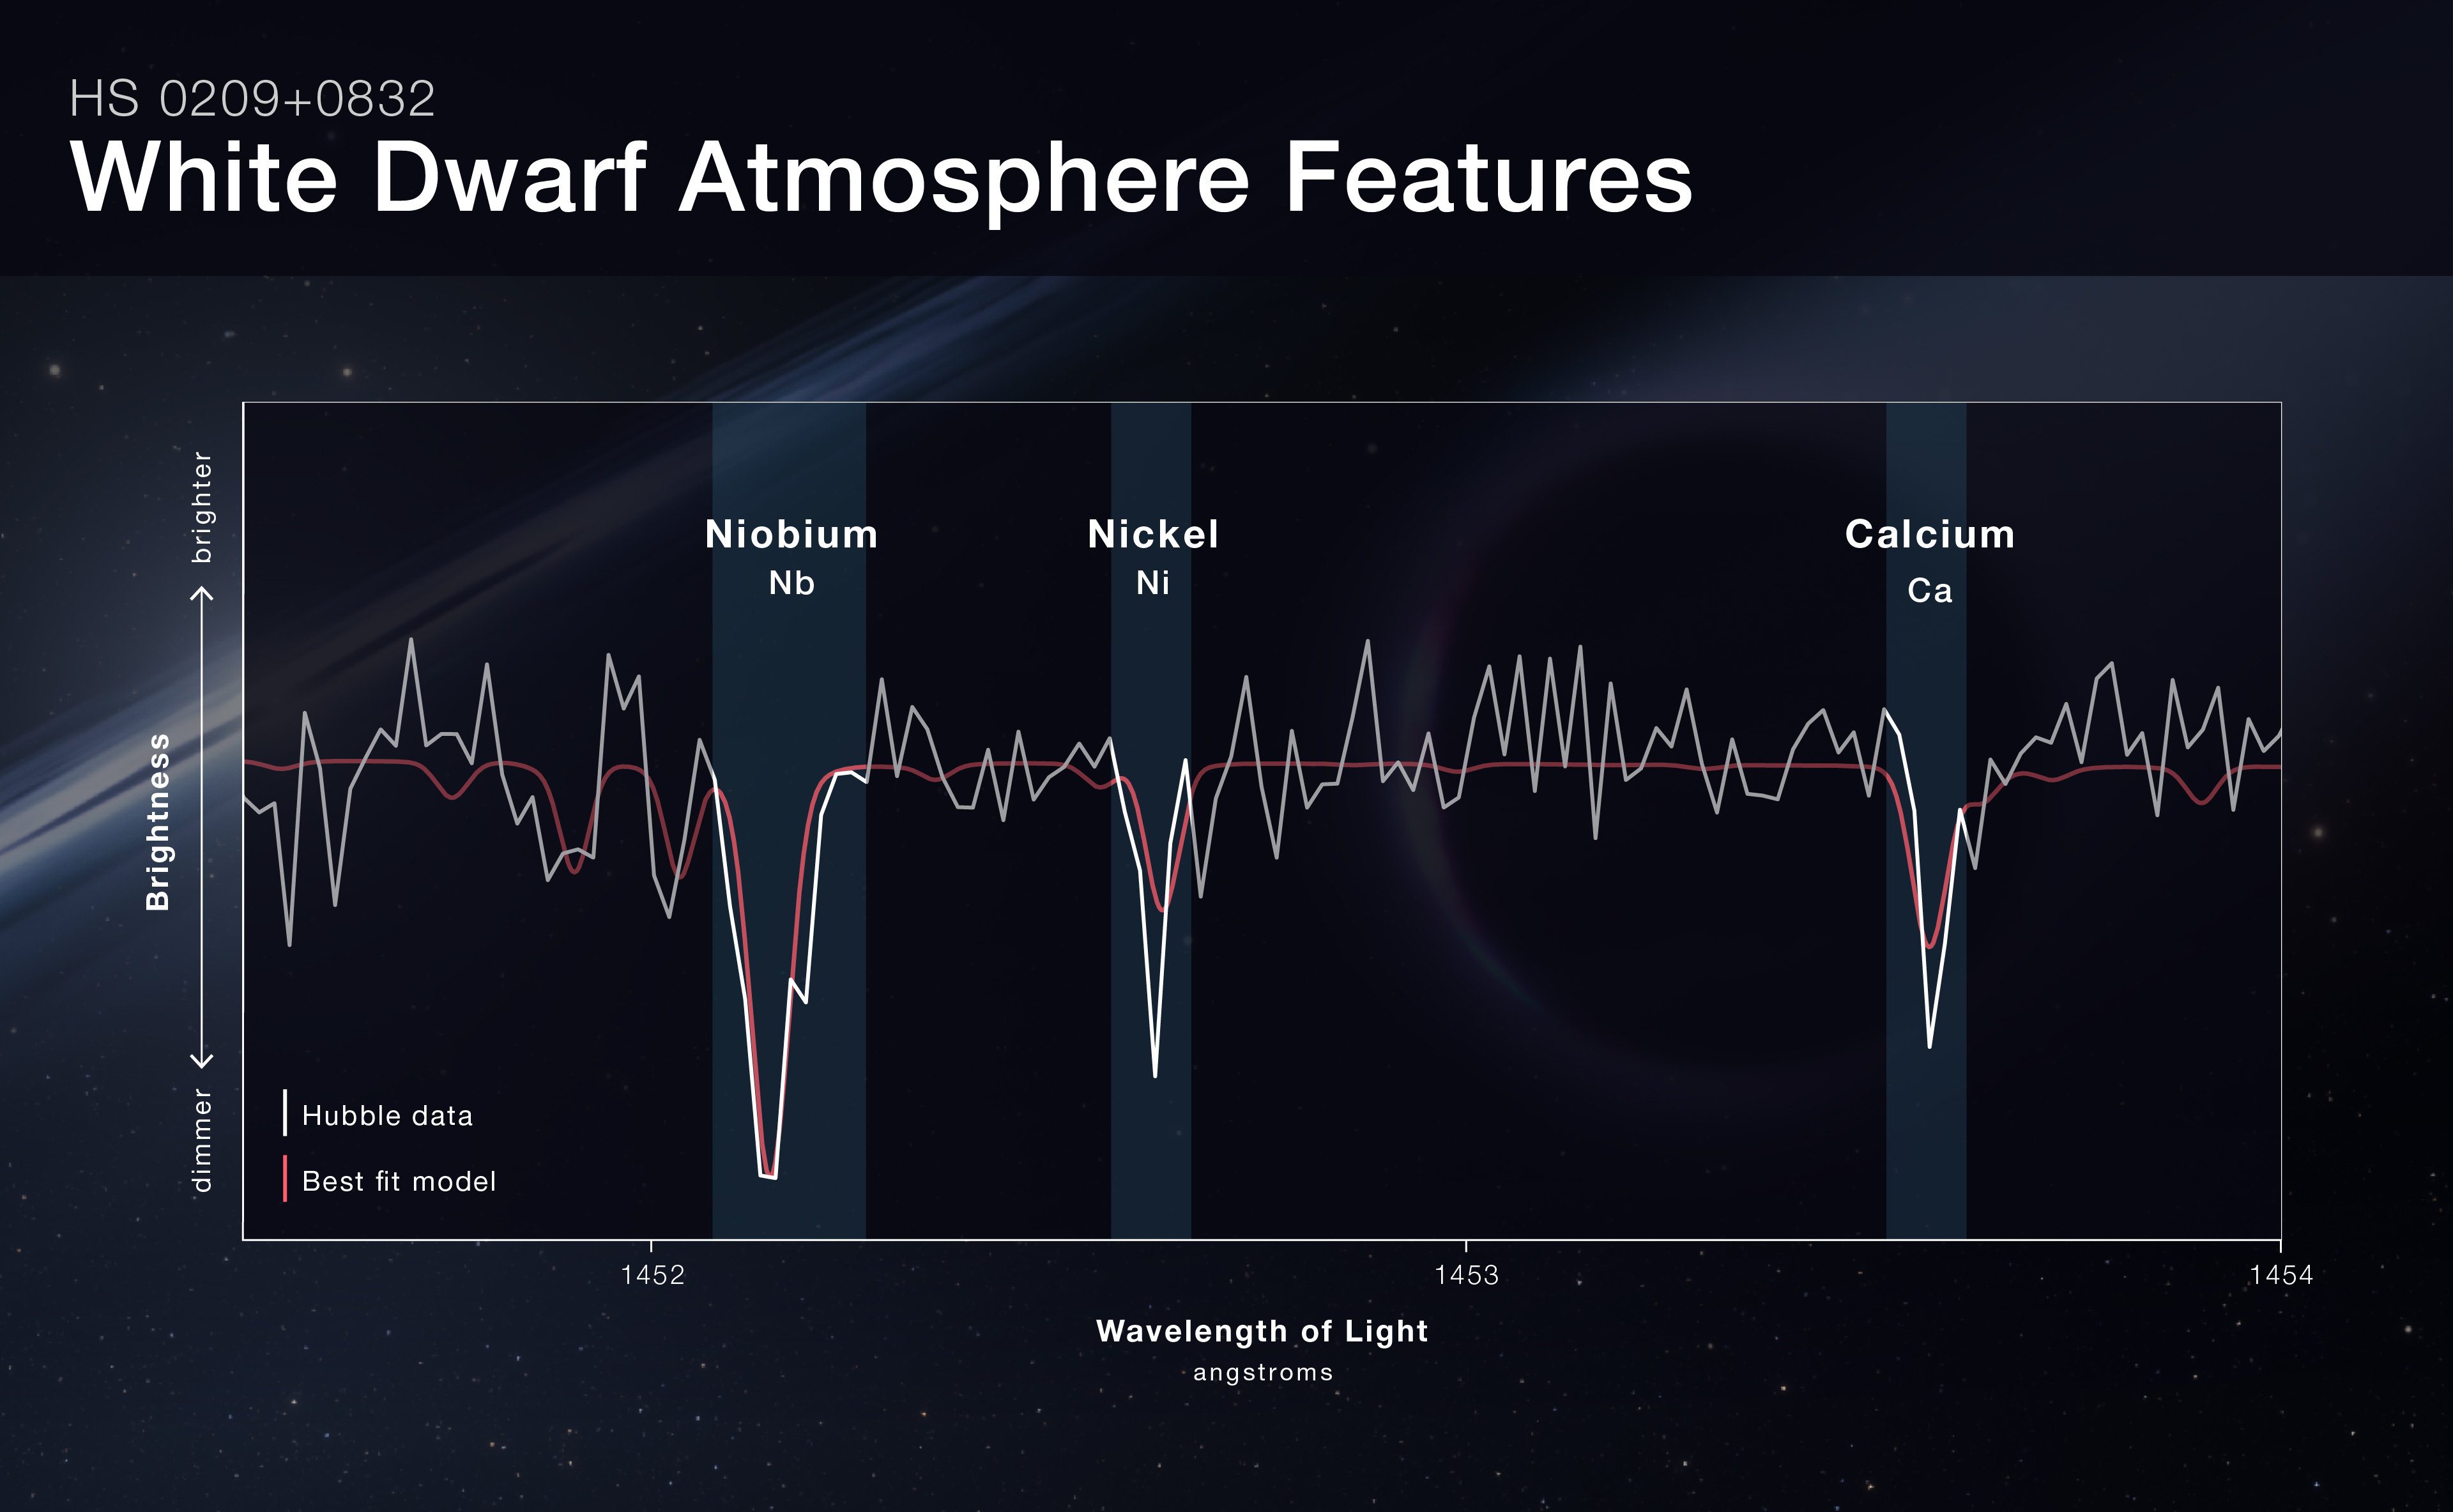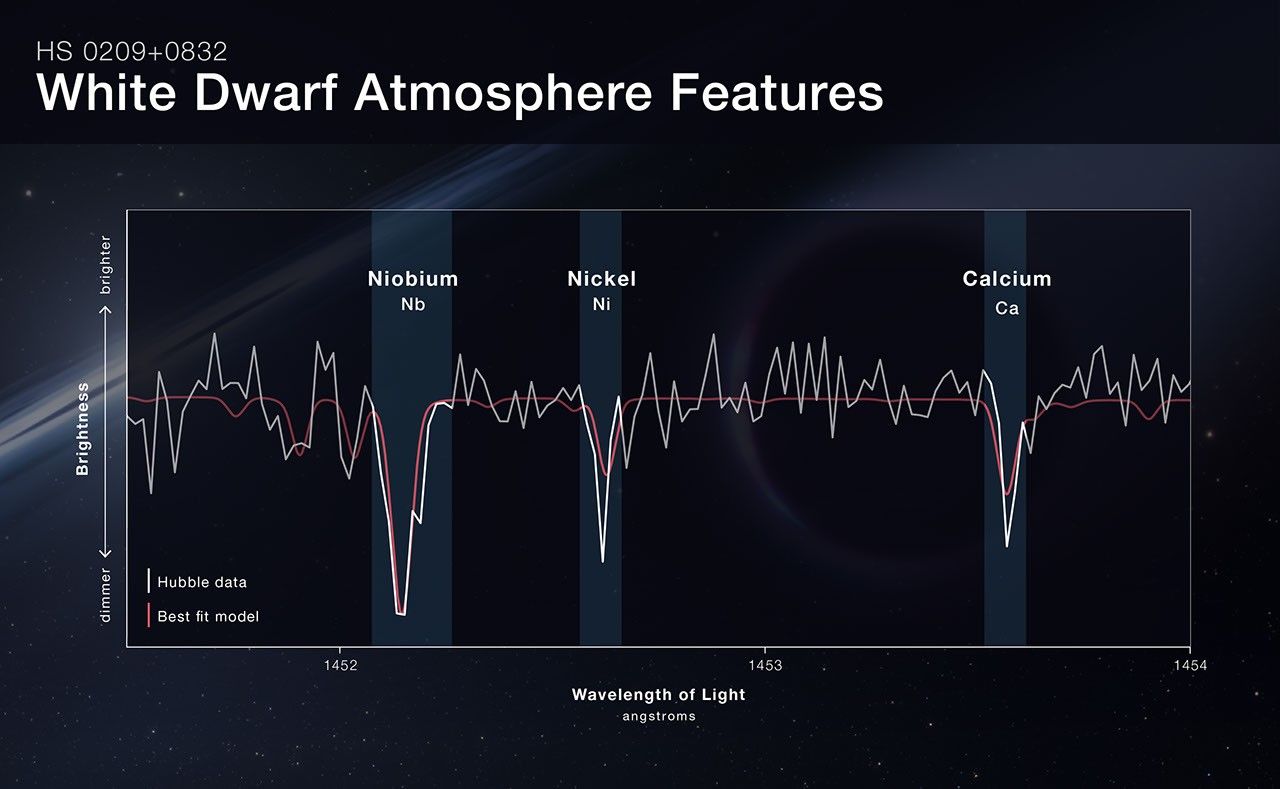
NASA’s Hubble Space Telescope spectrum shows the unusual abundances of certain elements it found in the HS 0209+0832 system. Dips indicate where niobium, nickel, and calcium are absorbing light, so less light in that part of the spectrum reached Hubble.The reason the starlight is showing elements that astronomers attribute to a planet has to do with interactions between the white dwarf star and planet. The white dwarf is still hot and is blasting the planet with radiation, causing it to lose atmosphere to space. That atmospheric material is flowing back toward the white dwarf, forming a disk and then falling back onto its surface.
Image Description: Line graph titled HS 0209+0832, White Dwarf Atmosphere Features. Hubble Space Telescope spectral data is shown in white, compared with a best fit model in red. The vertical y axis is labeled Brightness, with brighter at the top and dimmer at the bottom. The horizontal x axis is labeled Wavelength of light, angstroms. One-third of the way across the x axis is labeled 1452. To the right of the graph’s center is angstrom label 1453, and the right edge of the graph is labeled angstrom 1454. Three dramatic dips in the spectrum are labeled with element names and abbreviations: Niobium, Nb, Nickel, Ni, and Calcium, Ca. The niobium Hubble data and model match well and appear to the right of the 1452 angstrom label. To the right, Hubble’s nickel data is much dimmer than the model, appearing just left of the graph’s center. Hubble’s data for calcium is a little dimmer than the model, and appears to the right, about one-sixth of the way from the right-hand edge of the graph.
Image Description: Line graph titled HS 0209+0832, White Dwarf Atmosphere Features. Hubble Space Telescope spectral data is shown in white, compared with a best fit model in red. The vertical y axis is labeled Brightness, with brighter at the top and dimmer at the bottom. The horizontal x axis is labeled Wavelength of light, angstroms. One-third of the way across the x axis is labeled 1452. To the right of the graph’s center is angstrom label 1453, and the right edge of the graph is labeled angstrom 1454. Three dramatic dips in the spectrum are labeled with element names and abbreviations: Niobium, Nb, Nickel, Ni, and Calcium, Ca. The niobium Hubble data and model match well and appear to the right of the 1452 angstrom label. To the right, Hubble’s nickel data is much dimmer than the model, appearing just left of the graph’s center. Hubble’s data for calcium is a little dimmer than the model, and appears to the right, about one-sixth of the way from the right-hand edge of the graph.
| Release Date | October 5, 2026 |
|---|---|
| Science Release | Suspected Second-generation Planet Solves NASA Hubble Cold Case |
| Credit | Illustration: NASA, ESA, Leah Hustak (STScI) |
| Last UpdatedLocationContact | Oct 05, 2026NASA Goddard Space Flight CenterMediaClaire Andreoli NASA’s Goddard Space Flight Center Greenbelt, Maryland [email protected] |
| Last Updated | Oct 05, 2026 |
| Location | NASA Goddard Space Flight Center |
| Contact | MediaClaire Andreoli NASA’s Goddard Space Flight Center Greenbelt, Maryland [email protected] |
| Related Terms | Hubble Space Telescope, Stars, White Dwarfs |